Introduction
SnapDesk is the internet platform for visualizing complex IT environments and technical systems. Thanks to the vivid representation of elements, you are able to view the connections, understand them, and respond to them promptly.
SnapDesk was developed from the ground up to provide the user with a valuable tool, one with a simple operational concept, in order to assist you during critical situations. This puts you in the position to maintain an overview and control over your systems. It’s clear structure, and ease of use, allows everyone to become familiar with their respective environment. The training is simplified through the additional information which is provided, and clearly presented within the appropriate context.
Terminology
Below you will find the definitions of the most commonly used terms within the SnapDesk environment :
| Term | Description |
|---|---|
View |
Visual representation of the IT environment or parts thereof. |
System |
Physical Unit (Server or System) |
Service |
Indicator that describes how measurements are read. |
Agent |
Software program, which reads measurements in the customer’s environment based on the system service assignment, and transmits them to SnapDesk. |
Indicator Colors
The recurring indicator colors are used to represent the measurement condition, which are assigned as follows:
| Color | Description |
|---|---|
Red |
The measured value has reached the defined threshold, and is therefore indicated and notifications are sent out. |
Yellow |
The measured value has reached the defined threshold, but is not in a state of error. |
Orange |
The measured value indicates an error has occurred in the past, which has not yet been acknowledged. |
Grey |
The measured value is expired and will not be transferred to SnapDesk during the regular interval. |
Green |
The measured value has not reached a defined threshold and is not in a state of error. |
This order mirrors also the prioritization of errors. Each measured value will be assigned one of these states.
Minimum Requirements
Browser
SnapDesk uses the latest technologies, which are only available by using the latest browsers. Older browser versions do not support these modern features, and are therefore unsuitable.
A detailed list can be found here.
Operating System Agent
Since the agent has been programmed in JAVA, every operating system which supports a JAVA VM is supported. However, the agent uses different libraries, which means the functionality of unsupported operating systems cannot be guaranteed. For more information, see the note to the relevant service types.
General page design
SnapDesk’s approach is to make the navigation clear and representative of your environment at all times. The outline of the content also has a consistent appearance. You will always find the most important elements in the usual places.
Navigation
You have access to different areas of the tool based on your user permissions. As part of the navigation within SnapDesk, the consistent navigation menu is always located at the top of the page. The order of the menu items is displayed based on the frequency of use, and is complimented by direct access to the content created.

In the right area of the navigation bar, you will find the user settings, and the logout action. To the right of that you will find the SnapDesk server connection displayed. This connection is used for the transmission of measurements. The display can have the following states:
| State | Description |
|---|---|
Red |
No connection possible. Check your internet connection. |
Yellow |
Limited connectivity. The session has already ended, and therefore a re-login is required. |
Green |
Connection established. The data transfer is indicated by a white flashing border. |
Status
In the upper part of the view, is the overview of the current system status. The display adjusts to the available functions depending on the selected range, while still retaining the significance of the data.

➊ Section Title
➌ Actions (if available)
➋ View Status
➍ System-wide Status
➎ System Overview
Actions
Different actions are available depending on the area.
View Status
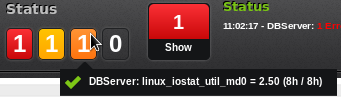
The status of the current view is divided into four basic types of notification, and is indicated with the respective color as soon as a issue occurs. In this regard, the indicator number can be used to investigate further using the context menu. Appropriate actions can be triggered directly from the alarming services.
System-wide Status
This particular indicator shows the status of all views, in which the number of highest priority errors is displayed. By clicking on the area, all views are displayed as thumbnails showing their current status, so that issues can be localized.
System Overview
Here you will find a list of systems with alarming errors. Here it is possible that systems display more errors then is possible to show within a particular view. A complete view is only possible, as long as all defined services are not used on the views. Direct access to the system or service is possible by using the stored links.
Content
The majority of the displayed pages are used for actual content. Here, the content is broken down into the defined views, as well as lists of the corresponding edit dialog.
Views
Views are used to visualize your IT environment or special, logically defined areas. It is possible to assign views via access permissions for a defined user or user group.
Indicator
The current status of the view is divided into four basic error classes, with corresponding colored indicators, as soon as an issue is detected. To this effect, the number is used as an indicator, with further investigation possible by using one of the context menus. Appropriate actions, such as Confirm and Analyze, can be used directly on the alarmed services.
Presentation
In the view, graphical elements are used, which can be connected to a system and its services in order to display the measurements. Depending on the error condition, the elements are color-coded, and allow a consistent visual perception based on popularity Indicator Colors.
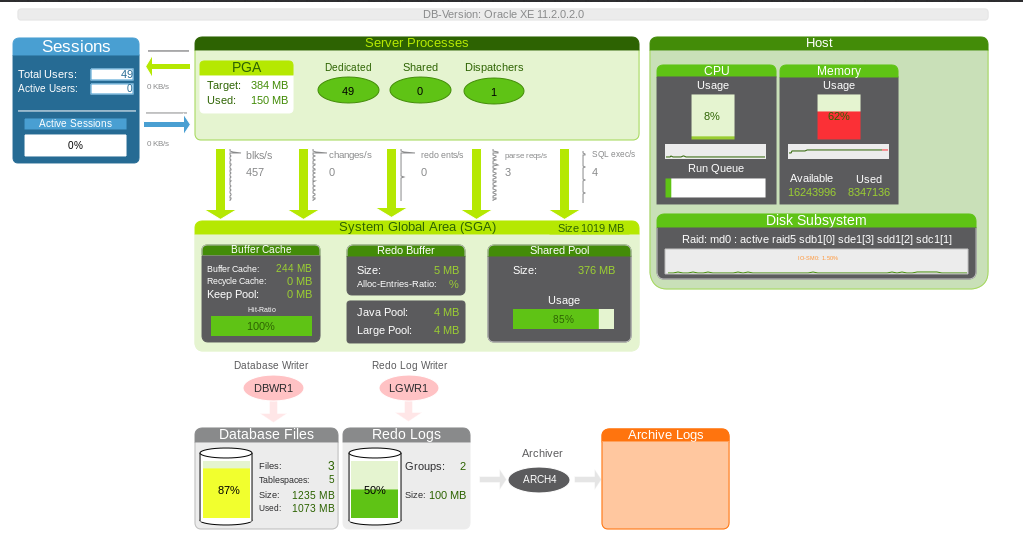
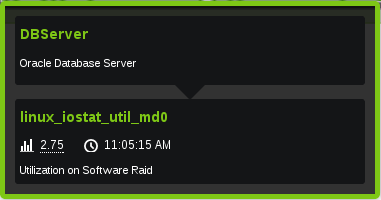
Facts (Tooltip)
The practical tooltips for a measured value gives you detailed information about the current measurement, and a description of the system and service, as long as these are available.
Detail View
The respective display areas of the measurements provide access to the history and Detail View' of the measurements with a simple mouse click. This makes it possible to investigate the measured values more accurately, and have an overview of important information.
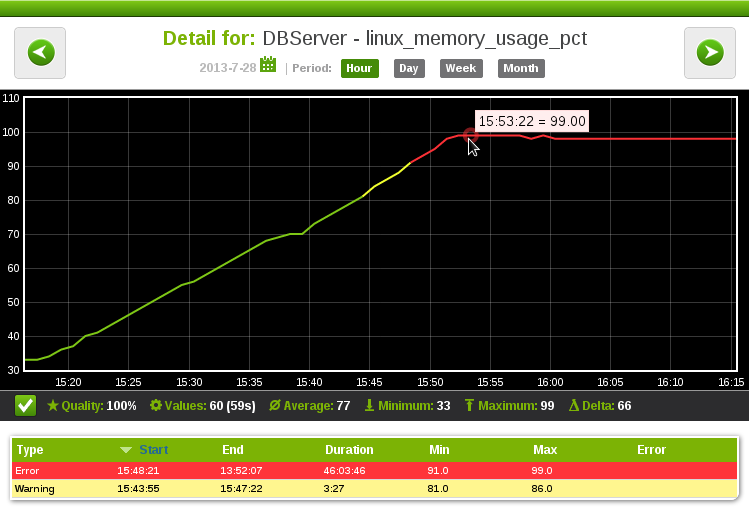
Detailed View
In the detailed view of a system and services, measurements are able to be analyzed precisely. You have access to the measurement history, and can investigate anomalies or any errors which may have been found.
When selecting a particular time range, the measured data will have a different level of accuracy. This is due to the higher data access speeds, as well as the suppression of anomalies.
| Time Range | Description of the accuracy |
|---|---|
Hours / Day |
Highest Accuracy - All available data is used. |
Week / Month |
Normal Accuracy - Hourly averages are used. |
Year |
Low Accuracy - Daily averages are used. |
Key Performance Indicators (KPI)
In the chart below, you will find the following figures:
| KPI | Description |
|---|---|
Quality |
Percentage ratio of the measured values with errors compared to the total number of readings. |
Values |
Number of available measurements and average time interval. |
Average |
Average of all measured values. |
Minimum |
Minimum value of all measured values. |
Maximum |
Maximum value of all measured values. |
Delta |
Absolute difference between the minimum and maximum values. |
Overview of warnings and errors
All errors diagnosed within the selected time range are shown in the detailed table overview. Here you will find information regarding the exact time, duration, key measurement points, as well as the possible cause of the error.
Editor
With the editor, you are able to model your environment and edit views. This is reachable either from the Navigation menu or View actions.
Toolbar
Both the access to the graphical objects, as well as the most important functions are performed via the toolbar.

➊ View Name + Save
➋ View Settings
➌ List of Graphical Elements
➍ Element-related Functions
The view settings are used to configure important settings within the view of SnapDesk:
| Setting | Description |
|---|---|
Sub-View |
The view is not displayed in the list of available views, but instead is only accessible as an element in the parent view. |
Edit Locked Objects |
Locked objects cannot be edited. |
Objects
For the presentation of views, the following graphical objects are available and can be linked to a system and service in order to display their respective measured values. The individual items can be personalized using numerous settings.
Note: Unless otherwise specified, the measurement condition changes the foreground color of an object.
| Type | Note |
|---|---|
Text |
displays the measured value using $service in the Text |
Rectangle |
|
Circle |
|
Queue |
Level display which fills with color based on the measurement level. |
Arrow |
|
Cloud |
Templates
Templates have a special meaning for the view, in that they create their own graphical objects. These graphical objects can be reused within other views or templates. Furthermore, they are used to provide a display for multiple systems, and display the measurements of each system using system allocation.
Templates are treated like normal views, but do not appear in the list of available views.
Configuration
In the Configuration area, you can make any settings necessary which have to do with the direct monitoring of your IT environment.
Systems
Systems represent the physical devices from which the measured values are obtained. Default settings are assigned to these systems regarding availability and allocation of services or service groups.
System groups are used to group the systems based on their logical memberships
Service
Service describes the process of the measurement query in which Type, Rate, type-specific settings, general settings, and error threshold are defined.
Types
The following types are available for selection, and offer different query options. The specific settings are listed in each table.
CMD
Command Line Call
Executes a command and returns its output
| Attribute | Description |
|---|---|
Command |
Command to Run |
Shell |
Operating system dependent command line (example: Windows cmd, Linux bash, etc.). |
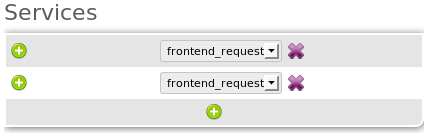
Formula
Synthetic Calculation
This type allows for the use of multiple services using a mathematical formula. These are defined in the dialog section Services. The use of this service type is suitable, for example, when making percentage calculations.
Note: It is not necessary, to assign the used services to a particular system. If the used services are not explicitly transferred to SnapDesk, then they will not incur a fee.
| Attribute | Details |
|---|---|
Formula |
Mathematical formula - Service-names are used as variables. |
Tip: Use the action Add to Formula to copy the service-name into the formula field.
HTTP
Hyper-text Transfer Protocol
This type performs an HTTP GET query. HTTP is a stateless protocol for data transmission over the internet, for transferring content (example: Websites)
| Attribute | Description |
|---|---|
URL |
Web address whose request should be evaluated (Protocol Specification "http://" required). |
Regular expression |
Expression to extract the value (reserved: size ⇒ Document return size). |
Note: In order to use a proxy for measurement queries, the agent must be configured accordingly. For more details, see Agents - Installation.
JDBC
Java Database Query
This type uses the database interface of the Java platform, which provides a single, vendor-independent interface to databases. This allows the execution of SQL queries and the transmission of measured values in the query results. The first column of the results list is then evaluated.
| Attribute | Description |
|---|---|
Drivers |
Java class for JDBC access (example: oracle.jdbc.OracleDriver). |
URI |
Database connection description |
Credentials |
Access authorization - this is located in the agent configuration file credentials. |
Query |
SQL Query |
Note: Please note that the specified drivers for the database used must be added to the lib directory of the agents.
JMX
Java Management Extension
The Java Management Extension is a Java typical specification for monitoring and managing Java applications.
The following simplified VM options must be used when starting your Java application in order for the JMX interface of an Oracle JavaVM to be available:
-Dcom.sun.management.jmxremote.port=
-Dcom.sun.management.jmxremote.authenticate=false
-Dcom.sun.management.jmxremote.ssl=false
Note: Consult the manufacturer’s documentation related to the JavaVM being used.
| Attribute | Description |
|---|---|
Port |
Port which can be access via the JMX interface. |
MBean |
Managed Bean, which provides an interface. |
Method |
Function to be performed. |
Arguments |
Arguments of the function to be executed. |
Attribute |
Attribute to be queried. |
Attribute entry |
Entry of an attribute when the attribute type is CompositeData. |
Note: Please note that the parallel usage of method and attribute will only execute the attribute query.
Ping
Simple Network Contact
This type tests the accessibility of the target host.
| Attribute | Description |
|---|---|
Host |
System to be queried. Here it is possible to enter either a Hostname, Network IP-address, or $system. |
Port
Network port testing
This type checks whether a port on the target host is accessible
| Attribute | Description |
|---|---|
Host |
System to be queried. Here it is possible to enter either a Hostname, Network IP-address, or $system. |
Port |
Numerical Port of the target host |
SNMP
Simple Network Management Protocol
SNMP is a network protocol that makes central monitoring and control of network components (routers, servers, switches, etc.) possible.
| Attribute | Description |
|---|---|
Host |
System to be queried. Here it is possible to enter either a Hostname, Network IP-address, or $system. |
Port |
Port, which can be accessed via the SNMP port (example: 161). |
Protocol |
Network protocol (UDP or TCP). |
SNMP-Version |
SNMP Protocol Version |
Community |
Community-Name through which the access rights are controlled. |
OID |
Number series with the separator "." (Period), through which the data can be clearly identified. The exact identification should be determined from the MIB of the device used. |
Rates
In addition to the general rate, the query frequency and the associated relevance of the measured value also determine the cost.
For more detailed information, please refer to the rate table on our Price list.
General Settings
General valid settings for each service type
| Attribute | Description |
|---|---|
Pro-Rated Calculation |
For differential measurements between two consecutive measurements, the time range can be specified in milliseconds, for the value which is to be converted. |
Decimal |
Number of decimal places to round to. |
Format |
Specification of the format used to convert the measured values into numerical values. |
Thresholds
Thresholds are used to determine the measurement condition. If a threshold has been defined, and the conditions valid, then the measured value is set to the specified error condition and indicated accordingly.
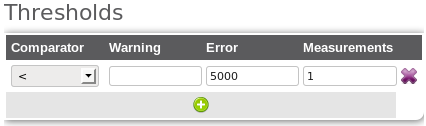
The use of the following attributes is possible, which can be repeatedly defined, and the most significant condition is indicated.
| Attribute | Description |
|---|---|
Comparator |
Comparison operator for thresholds. |
Warning |
Threshold for signaling a warning. |
Error |
Threshold for signaling an error. |
Measurements |
Number of consecutive measurements in order to reach the error state. |
Agents
Agents are stand-alone Java programs that are installed and configured in your IT environment. An HTTPS connect to SnapDesk is required in order to obtain the configuration of systems and services, to receive the respective measurements, and to transfer them to SnapDesk. The installation of the agents can be performed centrally or on each of the various systems.
Care has been taken in the development of SnapDesk in regards to the handling of confidential data. During the configuration of the agent, it is possible to store sensitive data directly on the local system.
Note: Java v1.5 or greater is required for the operation of the agents.
Installation
Please use your SnapDesk login in order to download the latest agents. Unzip the downloaded file into a directory of your choice, and use the following scripts depending upon your operating system to get started:
Windows: start.bat
Unix: Start.sh
The startup script checks and stores important environmental properties in the env.config in order to start the agents.
Note: Please ensure that the user, which is used to install the agents, has sufficient privileges to access the systems which are to be tested.
The file env.config has the following configuration entries:
| Attribute | Description |
|---|---|
JAVA |
Full path to the Java-Binary |
[http.proxyHost] |
Proxy which will be used to send the measured values |
[http.proxyPort] |
Proxy Port to Proxy Host |
Attributes in square brackets are optional configuration entries.
Configuration
Below you will find an overview of the configuration files used, and their contents:
agent.properties
Information for the identification of the agents is stored in this file. A user and the corresponding password is required for the transmission to SnapDesk. It is recommended to create separate SnapDesk users for use with the agents.
Below you will find the examples and their explanations:
| Attribute | Description |
|---|---|
identifier |
Unique identifier of the agents. You can send these per email from SnapDesk. |
Users to which the measured values are sent to SnapDesk |
|
password |
password of the user |
identifier=8d1c3ab6-9dx4-4ba2-a404-c35a53f81d31
email=demo@licuin.com
password=demo
credentials
The necessary credentials are stored in this file. There are several attributes available per unique identifier:
| Attribute | Description |
|---|---|
user |
User, for which the connection will be established |
password |
password of the user |
[poolsize] |
Number of connections, which the agent divides between all of the requests. This avoids having too many unnecessary connections due to simultaneous requests. |
Attributes in square brackets are optional configuration entries.
postgres.user=postgres
postgres.password=password

oracle.user=scott
oracle.password=tiger
oracle.poolsize=5
log4j.xml
Log Output configuration, through which the agent stores the program output files in the log directory based on the following definition.
Note: Detailed information about log4j can be found at Log4J-Documentation.
<?xml version="1.0" encoding="UTF-8" ?>
<!DOCTYPE log4j:configuration SYSTEM "log4j.dtd">

<log4j:configuration xmlns:log4j="http://jakarta.apache.org/log4j/">

  <appender name="console" class="org.apache.log4j.ConsoleAppender">
    <layout class="org.apache.log4j.PatternLayout">
      <param name="ConversionPattern" value="%d{ISO8601} %-5p [%t] %c: %m%n" />
    </layout>
  </appender>

  <appender name="agent" class="org.apache.log4j.DailyRollingFileAppender">
    <param name="datePattern" value="'.'yyyy-MM-dd" />
    <param name="file" value="log/agent.log" />
    <param name="Append" value="true" />
    <layout class="org.apache.log4j.PatternLayout">
      <param name="ConversionPattern" value="%d{ISO8601} %-5p [%t] %c: %m%n" />
    </layout>
  </appender>

  <logger name="agent">
    <level value="INFO"/>
    <appender-ref ref="agent"/>
  </logger>

  <root>
    <priority value="INFO" />
    <appender-ref ref="agent" />
    <appender-ref ref="console" />
  </root>

</log4j:configuration>
Notifications
Notifications are used to notify you about important events regarding your SnapDesk monitored IT environment. The notification system can be configured so that events can be combined to reduce the size of the email or SMS traffic, while still providing a structured overview of the events.
Essentially, the notification determines who will receive which event triggers for which systems and services. It is possible to explicitly remove notification events by selecting Revoked
Receiver
As a receiver, you can select between a user group or an individual user. The email addresses of these users must be valid.
Trigger
Triggers define which systems and services should be monitored, so that a notification of an occurring error will be sent out.
Access
Within the menu item access, you can configure your SnapDesk environment. Here you have access to settings which apply to all users, as well as for the configuration of users and user groups.
User
A SnapDesk user has access to the tool, and is identified by their unique email address. The initial password is sent to to this unique email address, which the user will use to login for the first time confirming the authenticity of the email address. This email will be used by the various functions of SnapDesk for the purpose of notification.
Below you will find a list of the available user profiles, which are listed in order of the level of access rights of the profiles:
| Profile | Description |
|---|---|
Guest |
Permission to access views without being able to change the data. |
Expert |
Can view and change configurations. |
Admin |
Can configure access settings. |
Permissions
In addition to the user profile, it is possible, through the assignment of views and systems, to give users access to specific areas. This makes it possible to monitor many environments within SnapDesk without being forced to give a user all permissions.
Security
To secure your SnapDesk access from unauthorized use, the following security mechanisms are used:
Passwort complexity
The complexity of user passwords is set to a high level making them difficult to crack. The following rules are used for setting passwords:
-
At least 8 characters long
-
At least 1 number or special character
-
At least 1 uppercase or lowercase character
Two-Factor authentication
This gives the user the ability to create, in addition to the password, a second key using the Generator which increases the difficulty of unauthorized access. The Generator creates one-time passwords, which are used either once, or are only valid for a short time.
➊ Yubikey - Key Generator
The Yubikey is an event-based, one-time password generator which was developed by the company Yubico. It is distinguished for its ease of use and continually growing user base.
➋ TOTP - Time-based one-time password algorithm
This type of key generation can be provided either via hardware or software. An example of an free software solution is Android Token.
ACL - Access Control List
Through the release of IP-address ranges within an public network, access from certain address ranges can be configured. This is particularly useful when you want to restrict access to within a corporate network, assuming that static IP-addresses have been assigned.